

In the last article, we discussed running Linux on your GameCube. This time we will look at debugging your regular applications/games (i.e, not running inside Linux, but directly on your GameCube). While GameCube is an older platform, it can still be interesting to explore. Some creative coders might also find the technical limitations inspiring. No matter why you find the platform interesting, you might need to debug your applications. Let's see how, and also how we can make it the most comfortable.
To be able to debug your applications, you will need:
- A GameCube or Wii console to debug on
- A way to run code on your GameCube/Wii. Can be something like Datel SD Media Launcher, modchips etc. This part is up to you
- DevkitPPC (gamecube-dev or wii-dev should install everything you need)
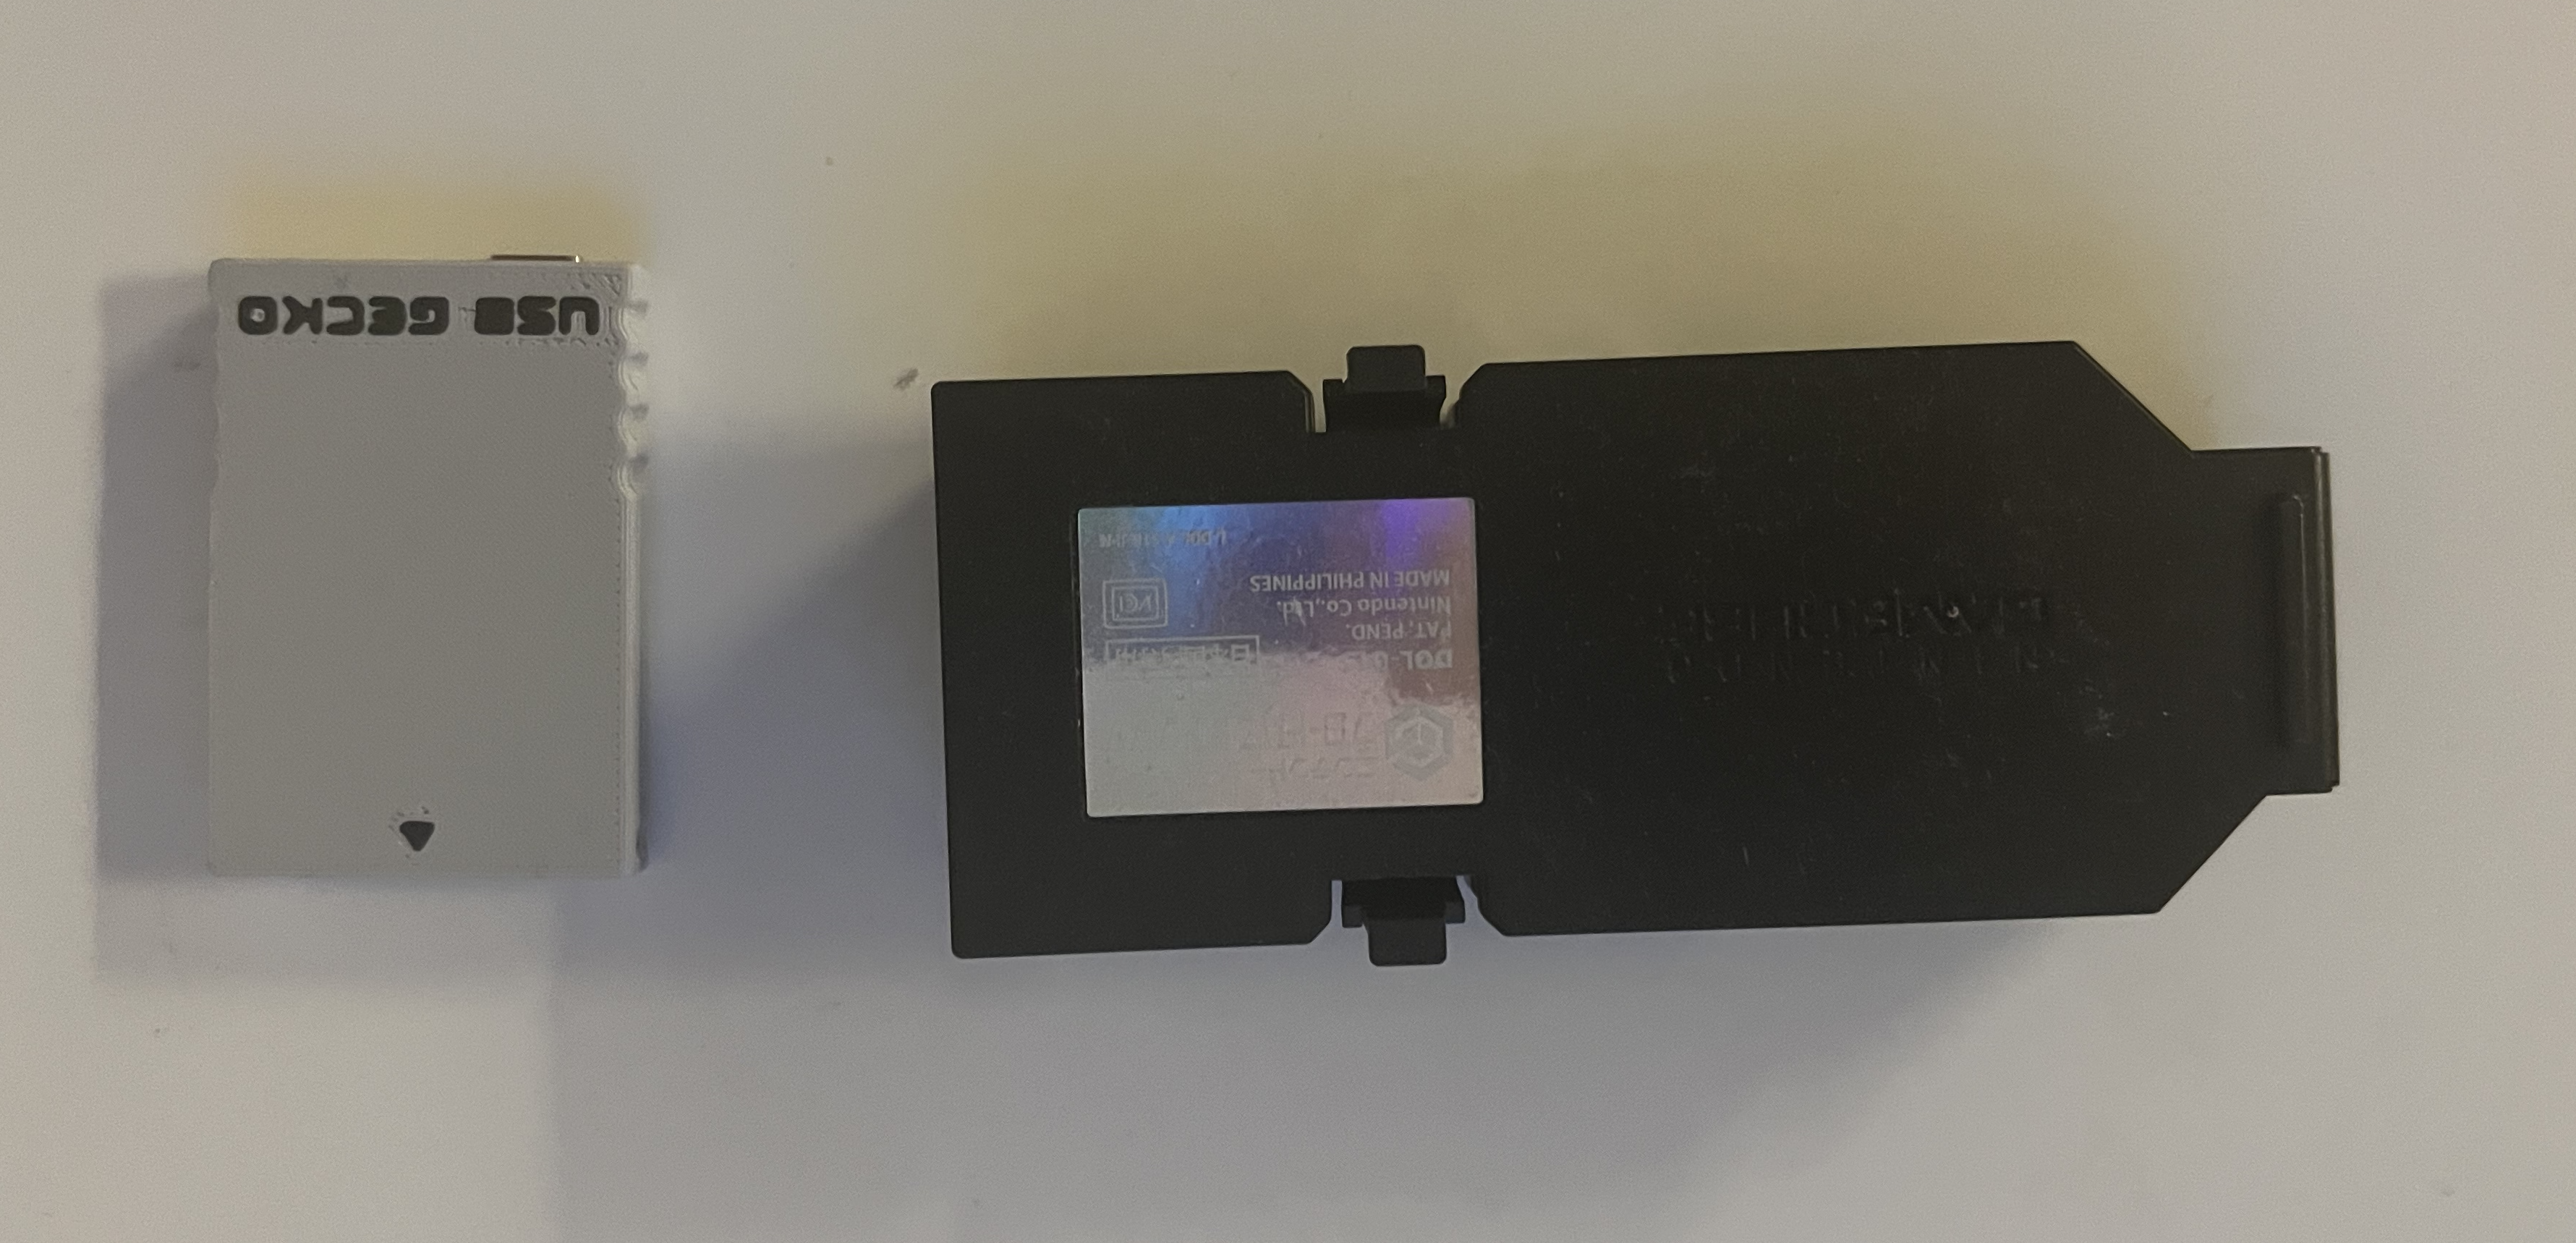
- a USB Gecko or Broadband adapter
NOTE: You might also need a driver for the USB Gecko. On my Macbook Air M1, I was able to just use the built in driver, but your mileage may vary. To my knowledge, it should work out of the box on Linux-based systems as well. On Windows you will probably need a driver of some kind to be recognized as a COM-serial port. WiiBrew has a great page that might help you with drivers and other useful information.
NOTE 2: Make sure your GDB version is correct. If you have installed DevkitPPC through pacman, it should be correct. GDB has had problems with USB Gecko after version 7.7.1, which is why an older version is included. No one seems to have found a fix for it. You can read about this in this Devkitpro forum thread.
Debugging for the GameCube can be a bit different from what you are used to. The basics are the same as any other place we debug using GDB, but our source code need to have some GDB initialization snippets as well. This snippet is included in libogc, which is the library most GameCube and Wii applications use. Why is this needed? How else would the GameCube know how to stop and wait for our GDB session to connect? Let's take a quick look at these snippets next.
GDB stub snippets
Depending on what way you want to debug, there are a few differences on the GDB code stub you put in your code. No matter what method you use, you should link your program with the db library (-ldb), and include debug.h in your program.
Option 1: USB Gecko
To use USB Gecko, we only need to a single line for initialization:
DEBUG_Init(GDBSTUB_DEVICE_USB,1);
This initializes our USB Gecko device to EXI Channel 1, which is the Memory Card in slot B (the second slot). If you would have wanted to use slot A, then you would have to change the channel to 0. Yet Another GameCube Documentation has a great writeup of EXI channels and devices.
Option 2: Network debug (broadband)
If you want to debug over the network using a broadband adapter, the stub itself is fairly simple:
DEBUG_Init(GDBSTUB_DEVICE_TCP, 5555);
This initializes the network to allow GDB attach request connections. The second argument is in this case the port we want to connect to, and has nothing to do with EXI channels. libogc provides a constant GDBSTUB_DEF_TCPPORT which defaults to 2828. You can use this instead of hard-coding a port number if you want to.
As this stub is a bit lightweight, it does not have complex network logic (getting a valid IP, finding gateways etc. automatically). This means we have to set those details ourselves:
const char *tcp_localip = "10.0.0.106";
const char *tcp_netmask = "255.255.255.0";
const char *tcp_gateway = "192.168.1.1";
NOTE: If you don't set these global variables, the network debugging will NOT work. This is due to the code declaring these values as extern-variables, and in the network implementation depending on them.
Common step: break
When you have chosen your way of debugging and inserted the GDB stub initialization code, you need one final thing: a break statement. This can be a bit confusing when you first see it. The initialization snippets only seem to initialize the hardware, and a separate instruction to wait for a GDB session to attach is necessary. Simply put this in your code where you want it to wait for your GDB connection:
_break();
Then the GameCube will wait at that position in your code for you to connect.
NOTE: While this instruction is called break, you don't use it for general breakpoints. It is only needed once in the code base for your application to know where to wait for GDB attachment request connections. You can set regular breakpoints like you are used to for GDB after this :)
Debugging using GDB directly
When you have done the above, debugging using
- Build your project with debug symbols. You should have a elf file and a dol file after doing this.
- Transfer the dol file to an SD card or similar way to run homebrew. If you have a modded GameCube, you might be able to burn a mini DVD or similar instead.
- Run the dol file. Remember to have the USB Gecko connected to your GameCube and computer, or have the network details ready if you debug using the network.
Connect using powerpc-eabi-gdb (included in DevkitPPC). You can use the elf-file as an argument to get symbols loaded. If you don't use it as an argument, you can specify it later in GDB with
symbol-file myelf.elf.Once gdb has started, you need to specify where to connect. This is either a device file for USB Gecko, or a connection string for network debugging. The syntax for connecting is
target remote connwhere conn is either the device file or the connection string.USB Gecko: This should point to the USB Gecko device file. On my Macbook Air this is /dev/cu.usbserial-GECKUSB0. On a Windows device (after installing drivers), it will be something like COM4.
Network debugging: In this case, you use the ip of the GameCube, as well as the port you specified in the GDB init stub. You should know of the ip from configuring the debug stub. The target should be ip:port (e.g, 10.0.0.106:5555).
- Debug your application like you are used to
You can read about the various commands that GDB supports in the man page for GDB (or this online version of it).
While this works pretty well, it is a bit tedious to what we are used to with modern and more visual debuggers. This brings us to…
Using Debug Adapter Protocol to get visuals like we are used to
Thanks to VSCode, we have the Debug Adapter Protocol. This standard provides a common way for editors to talk to debuggers, and is implemented in many editors including VSCode, Vim and Emacs. While GDB doesn't provide a way for us to connect using this protocol, there are middleware that do. WebFreak001 provides a VSCode extension that connects to GDB and visualizes the breakpoints, variables etc. like we are used to. The debug adapter part can be used by almost any editor, and we will use it from Emacs in the next section. Using this extension we can easily create launch configurations:
{
    "name": "GameCube debug",
    "request": "attach",
    "type": "gdbserver",
    "gdbpath": "/path/to/powerpc-eabi-gdb",
    "target": "10.0.0.106:5555",
    "executable": "/path/to/my.elf",
    "cwd": "/my/workspace/root"
}
(if you want to debug using USB Gecko, simply replace the target with your device file!)
What this will do is automatically load the symbol file (elf), connect to the target, and then start the debugging. You should probably set a few breakpoints in the code before connecting. Now we can debug like you are used to visually. If you create a launch.json, it should even work in Emacs given that you have set up dap-gdb-lldb (might not work if the rest of the project is not using LSP).
Adapting the process to Emacs
While Emacs has a built-in GDB command we could use, we would still need to write GDB commands the old fashioned way. To make our debugging more comfortable, we can use dap-mode. dap-mode makes it simple to use the debugger part of the extension mentioned above, as you only need to run a interactive command in Emacs after requiring dap-gdb-lldb. After that is done, we can create a debug template:
(dap-register-debug-template "GameCube debug"
			     (list :name "GameCube debug"
				   :type "gdbserver"
				   :request "attach"
				   :gdbpath "/path/to/powerpc-eabi-gdb"
				   :target "10.0.0.106:5555"
				   :executable "/path/to/my.elf"
				   :cwd "/my/workspace/root"))
As you can see, we have to specify our projects elf file each time. Most DevkitPPC projects will produce this elf-file in the root of the project. This is one of the assumptions of my Emacs GameCube debug package. Just run gamecube-debug-program from your source file, and the debugging information is setup automatically.
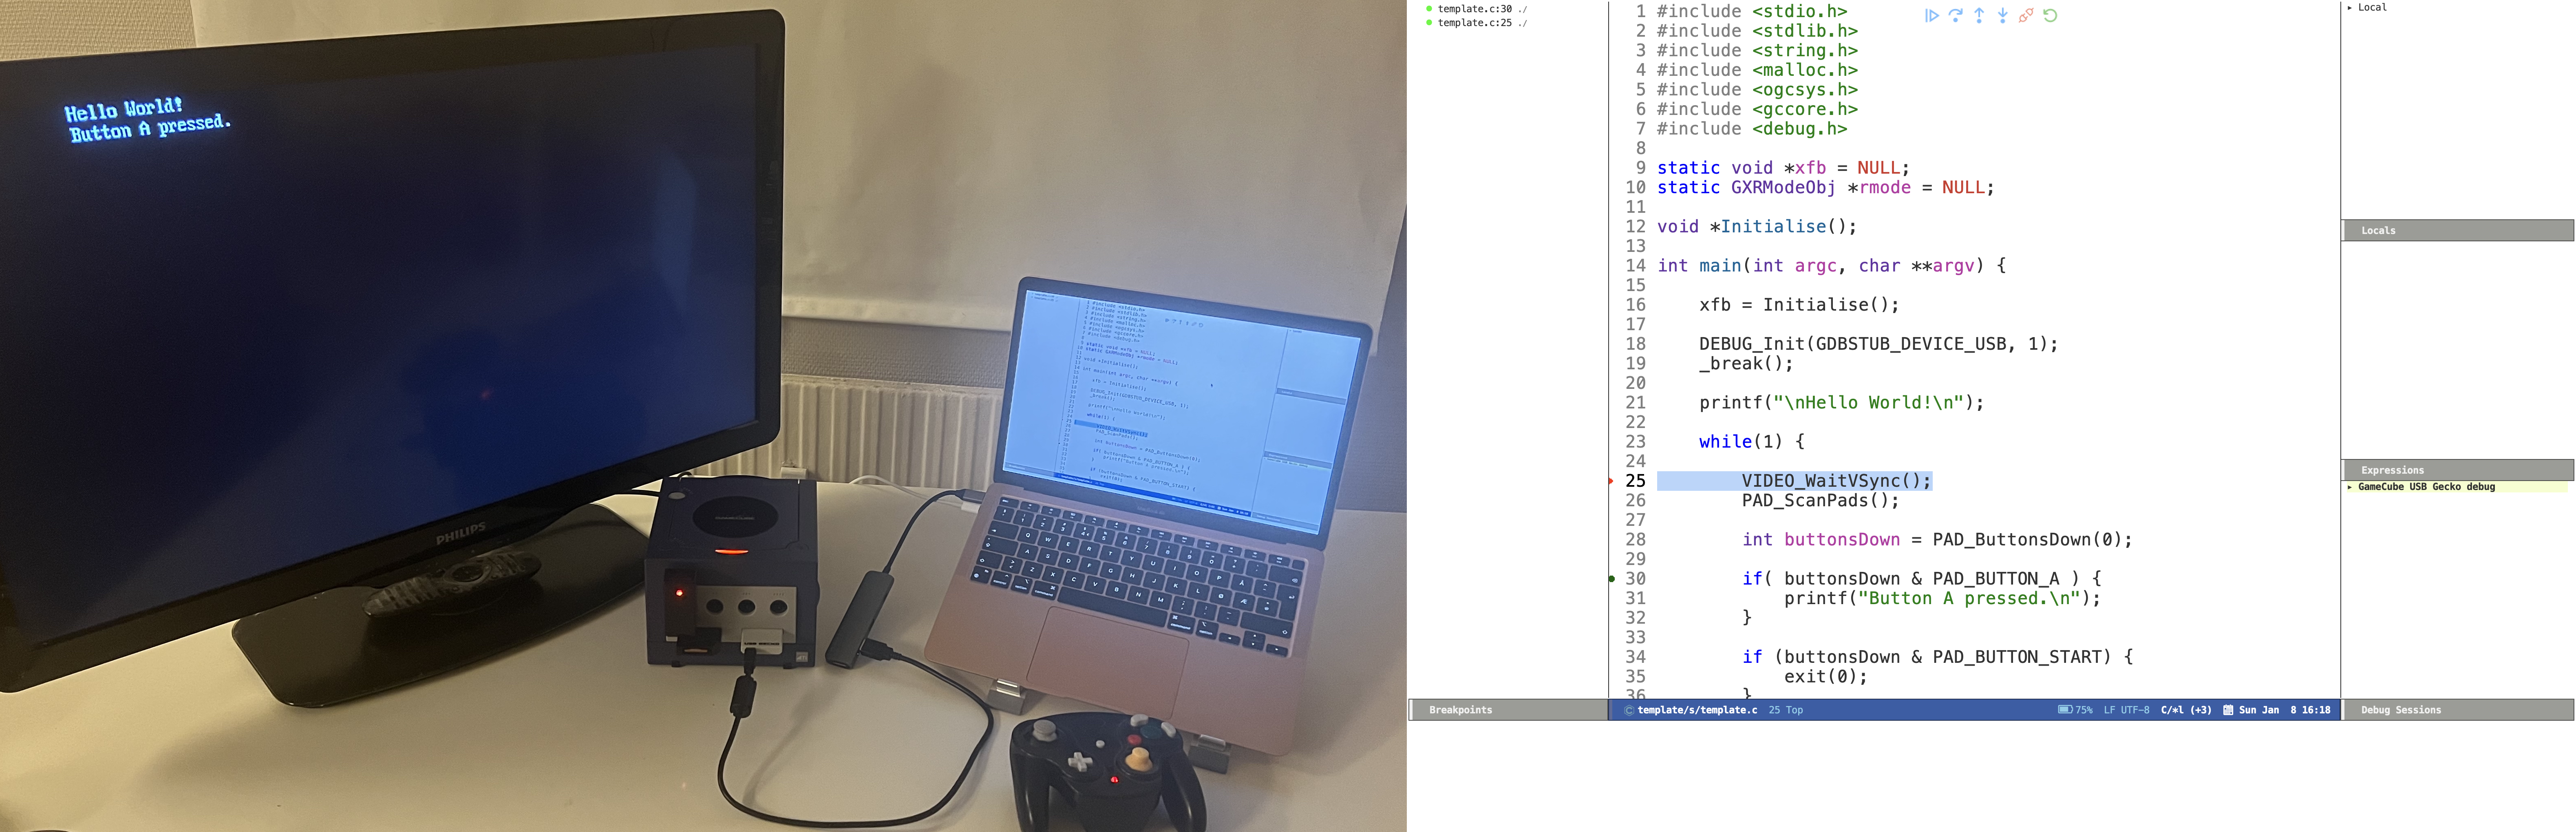
No matter how you choose to debug from Emacs, it will look something like this:
Possible issues
"Reading symbols from /path/to/my.elf…Dwarf Error: wrong version in compilation unit header (is 5, should be 2, 3, or 4) [in module /path/to/my.elf]"
This is caused by the newest versions of powerpc-eabi-gcc (version 12.1.0 from 2022 on my machine) defaulting to Dwarf-5 debug format, while powerpc-eabi-gdb (version 7.6.2 from 2013 on my machine) is not supporting it due to being an older version. Dwarf is a standard for debugging information, and is used by many different compilers today.
Why is the gdb version included with DevkitPPC an older version? This has to do with an unknown bug in newer versions than 7.7.1 causing errors and possible timeouts. No one has been able to find the solution it seems. You can read more about it in this Devkitpro forum thread.
Then how do we solve it? Just compiling our application/game and telling the compiler to use Dwarf-4 (or 2 or 3)? Well, yes and no. The dependencies (like libogc) are also compiled with newer versions, causing them to also be Dwarf-5. It does not seem to be any easy way to change the Dwarf version once something is compiled. This means that we also have to compile our dependencies to use an older Dwarf header. Fortunately, this is simple as long as we have DevkitPPC installed. For libogc, just add the following cflags to CFLAGS in the Makefile:
-gdwarf-4 -gstrict-dwarf
And then do the same for your application/game.

