


There are many cool tools for the command line out there! I always look out for new ones that can make me more productive, or maybe ones that just spice up my command line a bit. In this post I will share some tools like this with you, and also share some I'm not really super familiar with, but trying out. If you also love trying new command line tools, then this post is probably for you!
If you want to read about other command line tools, check out my other articles on it. These are cool command line tools, and more command line tools specifically.
Think all of this sound cool, but you feel like you need more basic command line skills? Check out my no nonsense guide to the command line!
k9s
Do you use Kubernetes? Do you also miss a monitor directly in your terminal? (compared to the UIs often given to us by OpenShift or similar). I know I did, which is why I enjoy k9s so much! k9s is a UI that shows you most of the information you need about your Kubernetes cluster. Pods in a workspace, logs, etc. Some features include:
- Reading logs (also based on time constraints)
- See resource definition yamls (kubectl describe)
- port forwarding
- deleting pods
The screenshots in the repo is quite good, so I won't share any here. These screenshots are most interesting with bigger projects, and my play-projects in a minikube cluster is probably not more interesting than the repos screenshots.
One issue I've had with k9s is that very big logs are often truncated (even when selecting the all option, not just time constrained). This might be a bug (or an issue with the infrastructure I was using at the time), but there is really no issue just using kubectl logs pod-name | less instead (replace podname with your actual pod). People have also told me about stern to tail several pods at a time, which might be worth checking out. You can use matchers to match a lot of pods to avoid doing several log calls.
HTTPie
This tool calls a HTTP endpoint and shows you the result. Wait, isn't that just cURL? Yes, and no. HTTPie is more opinionated, and has some nice features, including:
- Easier syntax than something like cUURL
- Highlighting and formatting of headers and JSON body.
- Persistent sessions / session handling
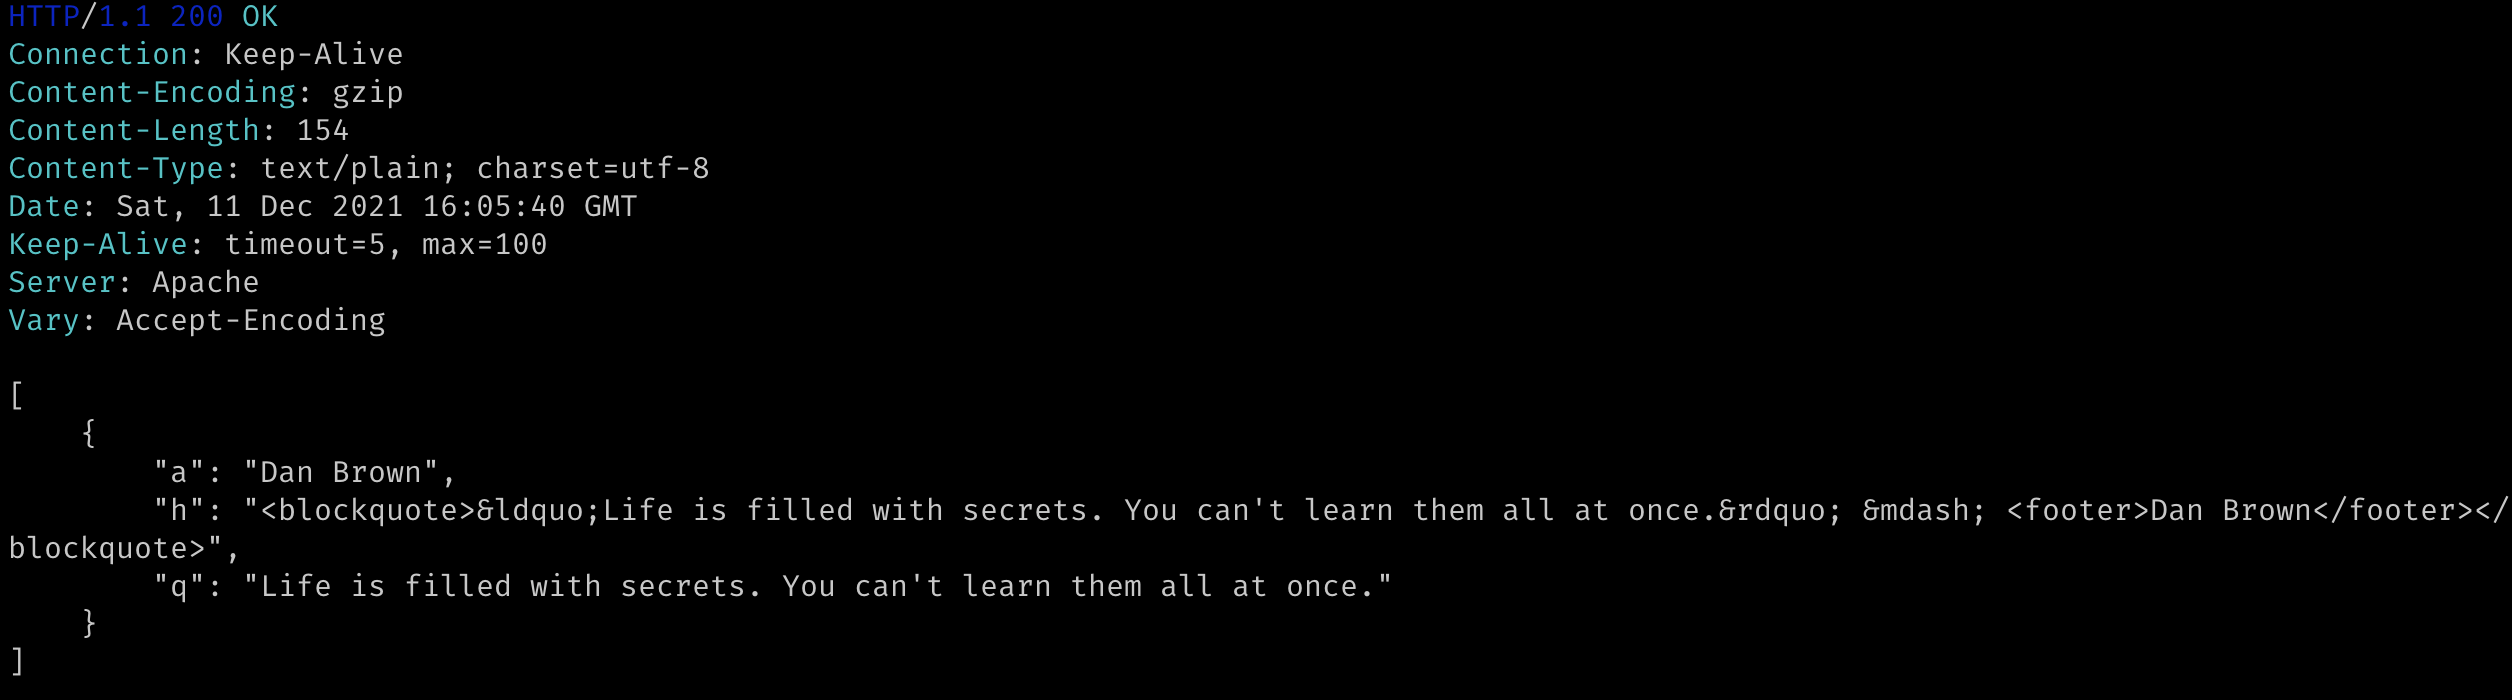
I still use curl sometimes, and prefer it in scripts (i.e, when I want to process the results further). That being said, HTTPie is great when I want more interactive usage. Let us see an example on how it looks with the ZenQuotes API today operation. The command is http https://zenquotes.io/api/today
chafa
Not really useful, but might be fun! Chafa shows images right in your terminal! Don't get too exited, the resolution will depend on the resolution in your terinal, and will usually be really pixelated. Let's see this blogs banner with chafa (command is just chafa imagefile).

You might be thinking: what can this be used for??? I can think of two use cases:
- Quick previews of images in the command line. Just to see the essence of what a file in a directory is, which is what I use Chafa for. (useful when I forget to have descriptive names, ooops!)
- More advanced graphics in scripts. banners etc.
Tools that might be worth checking out
I do not currently use these tools, and have barely experimented with them or read about them. They might prove useful or fun to you :)
- fd: The find program is something a lot of people forget about the arguments to, especially if they don't use it often. fd has a cleaner interface to search for files, and also ignore files from .gitignore, making it great for projects. I'm too used to just using find at this point, but if I remember it, I will try to introduce fd into my workflows in the future.
- trigger: Do you want to trigger a command every time changes are done to a file (e.g, saving it)? Then trigger is for you.
- wrk: Load-testing of HTTP APIs. You can run a benchmark for a specified number of time, with a specified number of threads, or other settings. Then you can see the results like time taken for each request etc. Read about this tool in a book, and thought it sounded cool. Will definitely try it when I make another REST API or similar, especially when I want to test performance. Maybe it can be useful for you as well?
- icdiff: icdiff is cool little tool showing you side by side differences between two files (including colored highlights!). Seems really cool, but have not used it much yet.
- browsh: I used to use Lynx as a web browser in the terminal a lot. It has some obvious drawbacks, especially that the rendering is way different than a standard web browser. This is where browsh comes in! browsh shows the real web page layouts with pixelated images, which makes for an "advanced" browser running in your terminal! It even supports WebGL! Could not get it to work with my M1 Mac, but will try again soon (or try on another computer). This truly seems like Lynx on steroids!

